IntroductionTranscranial alternating current stimulation (tACS) is widely used to modulate brain activity, yet its mechanisms remain incompletely understood and its effects vary across individuals and studies [1]. When nonlinear neural circuits are driven by sinusoidal input, responses often contain harmonic frequencies in addition to the stimulation frequency [2]. Although commonly observed in neural recordings, the dynamical origin of these harmonics remains unclear. We hypothesized that harmonic structure may reflect the balance of excitation and inhibition in the stimulated network.
MethodsWe used a Wilson–Cowan mean-field model to examine how recurrent connectivity, transfer-function gain, and input amplitude shape harmonic responses under periodic drive. Model predictions were evaluated using broadband LFP recordings from macaque V4 during prefrontal tACS (N = 17 sessions; randomized blocks at 5 and 10 Hz; [3]). Power spectra were computed from 60-s segments (frequency resolution ≈ 0.017 Hz), with all harmonics well below the Nyquist limit. Results were consistent using both fast Fourier transform (FFT) and Welch spectra. For comparison, we also implemented a spiking leaky integrate-and-fire (LIF) network with balanced connectivity.
ResultsIn the Wilson–Cowan model, harmonic structure depended on the population’s operating regime, determined by net E–I connectivity and input amplitude. Activity near the transfer function’s inflection region produced predominantly odd harmonics, whereas excursions toward ceiling or floor regions generated even harmonics (Fig. 1). Across 193 experimental epochs, 88% showed entrainment to the input frequency. Among these, 84% exhibited odd harmonics, 16% were restricted to the fundamental frequency, and none displayed even harmonics. The LIF network reproduced both odd and even harmonic patterns under comparable connectivity regimes.
DiscussionOur results show that harmonic structure during rhythmic stimulation reflects the circuit operating point, determined by E–I balance and input strength. Changes in gain modify the width of odd-dominant regions but preserve the overall pattern of responses. The predominance of odd harmonics in the experimental data is consistent with model regimes associated with balanced excitation–inhibition dynamics typical of healthy cortical networks. Together, these findings suggest that harmonic analysis could provide a non-invasive probe of cortical state, and that physiological or behavioral changes affecting network gain may alter harmonic profiles.
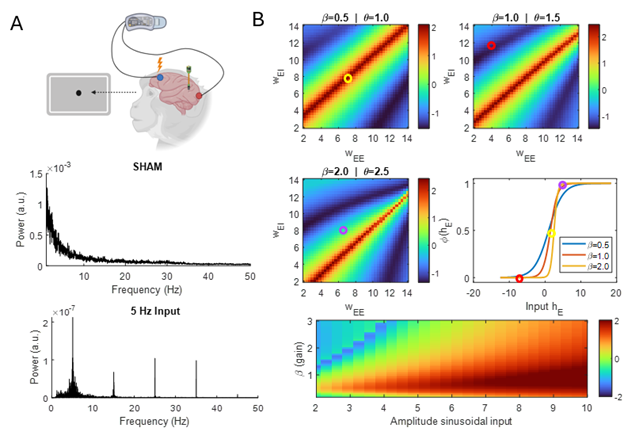 Figure 1. (A) Power spectrum of experimental recordings during SHAM and 5 Hz sinusoidal stimulation. Stimulation induces odd harmonics (15–35 Hz). (B) Log10-OEHR heatmaps from the Wilson–Cowan model showing harmonic dominance across recurrent connectivity (red = odd, dark blue = even). Connectivity sets the net input to the sigmoid transfer function and thus the operating regime (circles).
References1. Krause MR, Vieira PG, Pack CC. (2023). Transcranial electrical stimulation: How can a simple conductor orchestrate complex brain activity?.
PLOS Biology 21(1): e3001973.
https://doi.org/10.1371/journal.pbio.30019732. Jin C, Wang X, Chen B, Wan H, Lu Z, Sun Y, Sun Y, Bu J. (2026). Media Transmission Characteristics of Harmonic Signatures in tACS: From Simple Linear Phantoms to Complex Biological Systems,
Brain Stimulation, https://doi.org/10.1016/j.brs.2026.103052.
3. Krause MR, Vieira PG, Thivierge JP, Pack CC. (2022). Brain stimulation competes with ongoing oscillations for control of spike timing in the primate brain.
PLOS Biology 20(5): e3001650.
https://doi.org/10.1371/journal.pbio.3001650AcknowledgementThank you to C. C. Pack, P. Vieira and M. R. Krause for the experimental data.