IntroductionLinear predictive models provide a computationally efficient starting point for estimating effective connectivity. However, multicollinearity of fMRI is a major challenge, which may cause overfitting and instability. Previous approaches have used partial conditioning or sparse modelling to reduce overfitting which may exclude relevant predictors [1]. Moreover, low-frequency BOLD signals result in strong autoregression in the timeseries, which dominates the models. In this work, we evaluate – in terms of cross-validated predictability – various approaches to building multivariate autoregressive (MVAR) whole-brain effective network models of fMRI brain activity, which specifically handle their strong multicollinearity and autoregression.
MethodsThe HCP rfMRI data were denoised, detrended, and deconvolved [2]. The data were parcellated using the Gordon atlas and analysed as a 333-node whole-brain ROI network. For each node, a first-order univariate autoregressive model was fitted, and its out-of-sample R
2 was computed as the baseline. MVAR models were then built incorporating all other sources at the previous time step, to predict both original time series and residuals after subtracting autoregressive components, using ridge-regularised first-order least-squares regression. Model performance was evaluated using the mean out-of-sample R
2 across nodes (90% training / 10% testing). The ridge penalty λ with the highest mean R
2 was selected.
ResultsThe problem of collinearity and high dimensionality is highlighted in that MVAR models predicting original time series perform worse than baseline self-predictive models, whether ridge regression is included or not. Improvements were only achieved with models predicting residuals after autoregression, with optimal ridge parameter (λ = 30.0) giving a mean out-of-sample R
2 of 0.0347. Using the Yeo 7 modules [3], visual and somatomotor systems exhibited the highest predictability (R
2 > 0.0400). Limbic regions showed lower predictability (R
2 of 0.00658). The effective connectivity matrix from the residual model exhibits asymmetric directed influences, with modular organisation aligned with the Yeo 17 modules (Fig. 1) [3].
DiscussionThe higher predictability of visual and somatomotor regions in the one-step model is consistent with their relatively short temporal windows, which may support rapid perceptual and sensorimotor processing [4]. Within the visual system, the strong links between Visual A and Visual B are also consistent with its hierarchical feedforward and feedback organisation. Visual A appears to pass information to Visual B, while Visual B shows strong coupling with control networks. This may reflect a pathway through which visual information is processed, then activates frontoparietal control network. In contrast, the lower predictability of limbic regions may reflect slower, more internally driven dynamics related to memory and emotion [4].
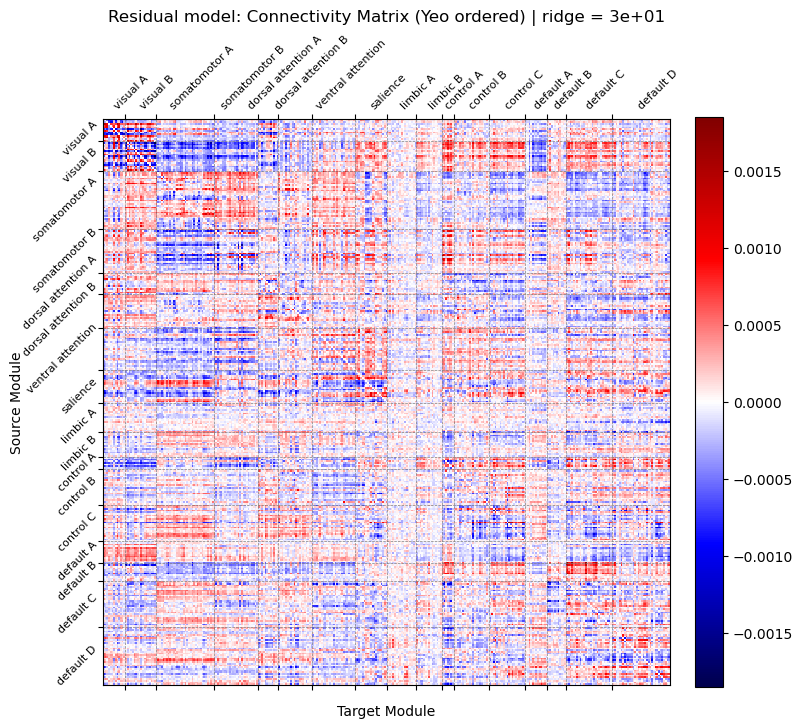 Figure 1. Connectivity matrix estimated from residual model using ridge regression (λ = 30.0) and reordered by Yeo 17 functional networks. The value at row i and column j represents the predictive weight from source node i to target node j. Red: positive predictive weights. Blue: negative predictive weights.
References - Valdés-Sosa, P. A., et al. (2005). Estimating brain functional connectivity with sparse multivariate autoregression. Philosophical Transactions of the Royal Society B: Biological Sciences, 360(1457), 969–981.
- Smith, S. M., et al. (2013). Resting-state fMRI in the Human Connectome Project. NeuroImage, 80, 144–168.
- Yeo, B. T. T., et al. (2011). The organization of the human cerebral cortex estimated by intrinsic functional connectivity. Journal of Neurophysiology, 106(3), 1125–1165.
- Gollo, L. L., et al. (2015). Dwelling quietly in the rich club: Brain network determinants of slow cortical fluctuations. Philosophical Transactions of the Royal Society B: Biological Sciences, 370(1668), Article 20140165.