IntroductionIntrinsic neural timescales quantify how long neurons integrate information, a fundamental metric of brain organization [1]. Yet accurate brain-wide mapping has been limited by two methodological challenges: binned autocorrelation methods underestimate timescales in low-firing neurons, and single-exponential models obscure multi-component temporal structure. We addressed both by combining iSTTC (intrinsic Spike Time Tiling Coefficient) [2] with multi-exponential modeling [3]. Applied to 89,047 neurons across 266 mouse brain regions (IBL 2025 dataset), this framework enables timescale estimation in low-firing neurons and captures multi-component temporal structure, providing broad coverage across 86% of mouse brain regions.
MethodsWe analyzed spontaneous spiking activity from 580,598 units across 427 sessions and 131 mice in the IBL 2025 Brainwide Map Release. Units meeting quality criteria (≥100 spikes, declining autocorrelation, R^2 ≥ 0.5) were retained (89,047 units). Timescales were estimated using iSTTC, and each autocorrelation fitted with 1-4 exponential components, with optimal complexity selected by BIC. The amplitude-weighted effective timescale \u200bτ_eff captures the overall integration window of a neuron, weighted by the contribution of each exponential component. To test the anatomical gradient, we fitted a Bayesian hierarchical model with random intercepts for region, mouse, session, and probe.
ResultsMedian τ_eff spanned nearly two orders of magnitude across regions (37.9-3,115 ms), following a rostro-caudal gradient: forebrain 213 ms (IQR = 120-304 ms), midbrain 765 ms (IQR = 482-968 ms), hindbrain 956 ms (IQR = 723-1183 ms). This gradient was observed in 100% of individual mice (median Spearman ρ = 0.76, p < 10⁻³⁰). A Bayesian hierarchical model controlling for mouse, session, and probe confirmed brain region as the dominant variance source (24.1%), with substantial within-region heterogeneity remaining (median IQR = 588 ms). 73.9% of neurons required multi-component models: τ₂ co-varied sublinearly with τ₁ across regions (r = 0.766, p = 9.68 × 10⁻⁴⁴, slope = 0.545).
DiscussionAnatomical position along the rostro-caudal axis is a strong organisational principle of intrinsic neural timescales, holding robustly across 220 regions. The longer timescales of midbrain and hindbrain may reflect their roles in integrating homeostatic, motor, and state-related signals over extended periods. The majority of neurons (73.9%) are better described by multiple timescale components; τ₁ may reflect intrinsic neuronal properties, while τ₂, extending to several seconds, points to recurrent network interactions or neuromodulation. Within-region variance (median IQR=588 ms) likely reflects cell type, laminar position, and local connectivity, motivating future integration with anatomical cell-type data.
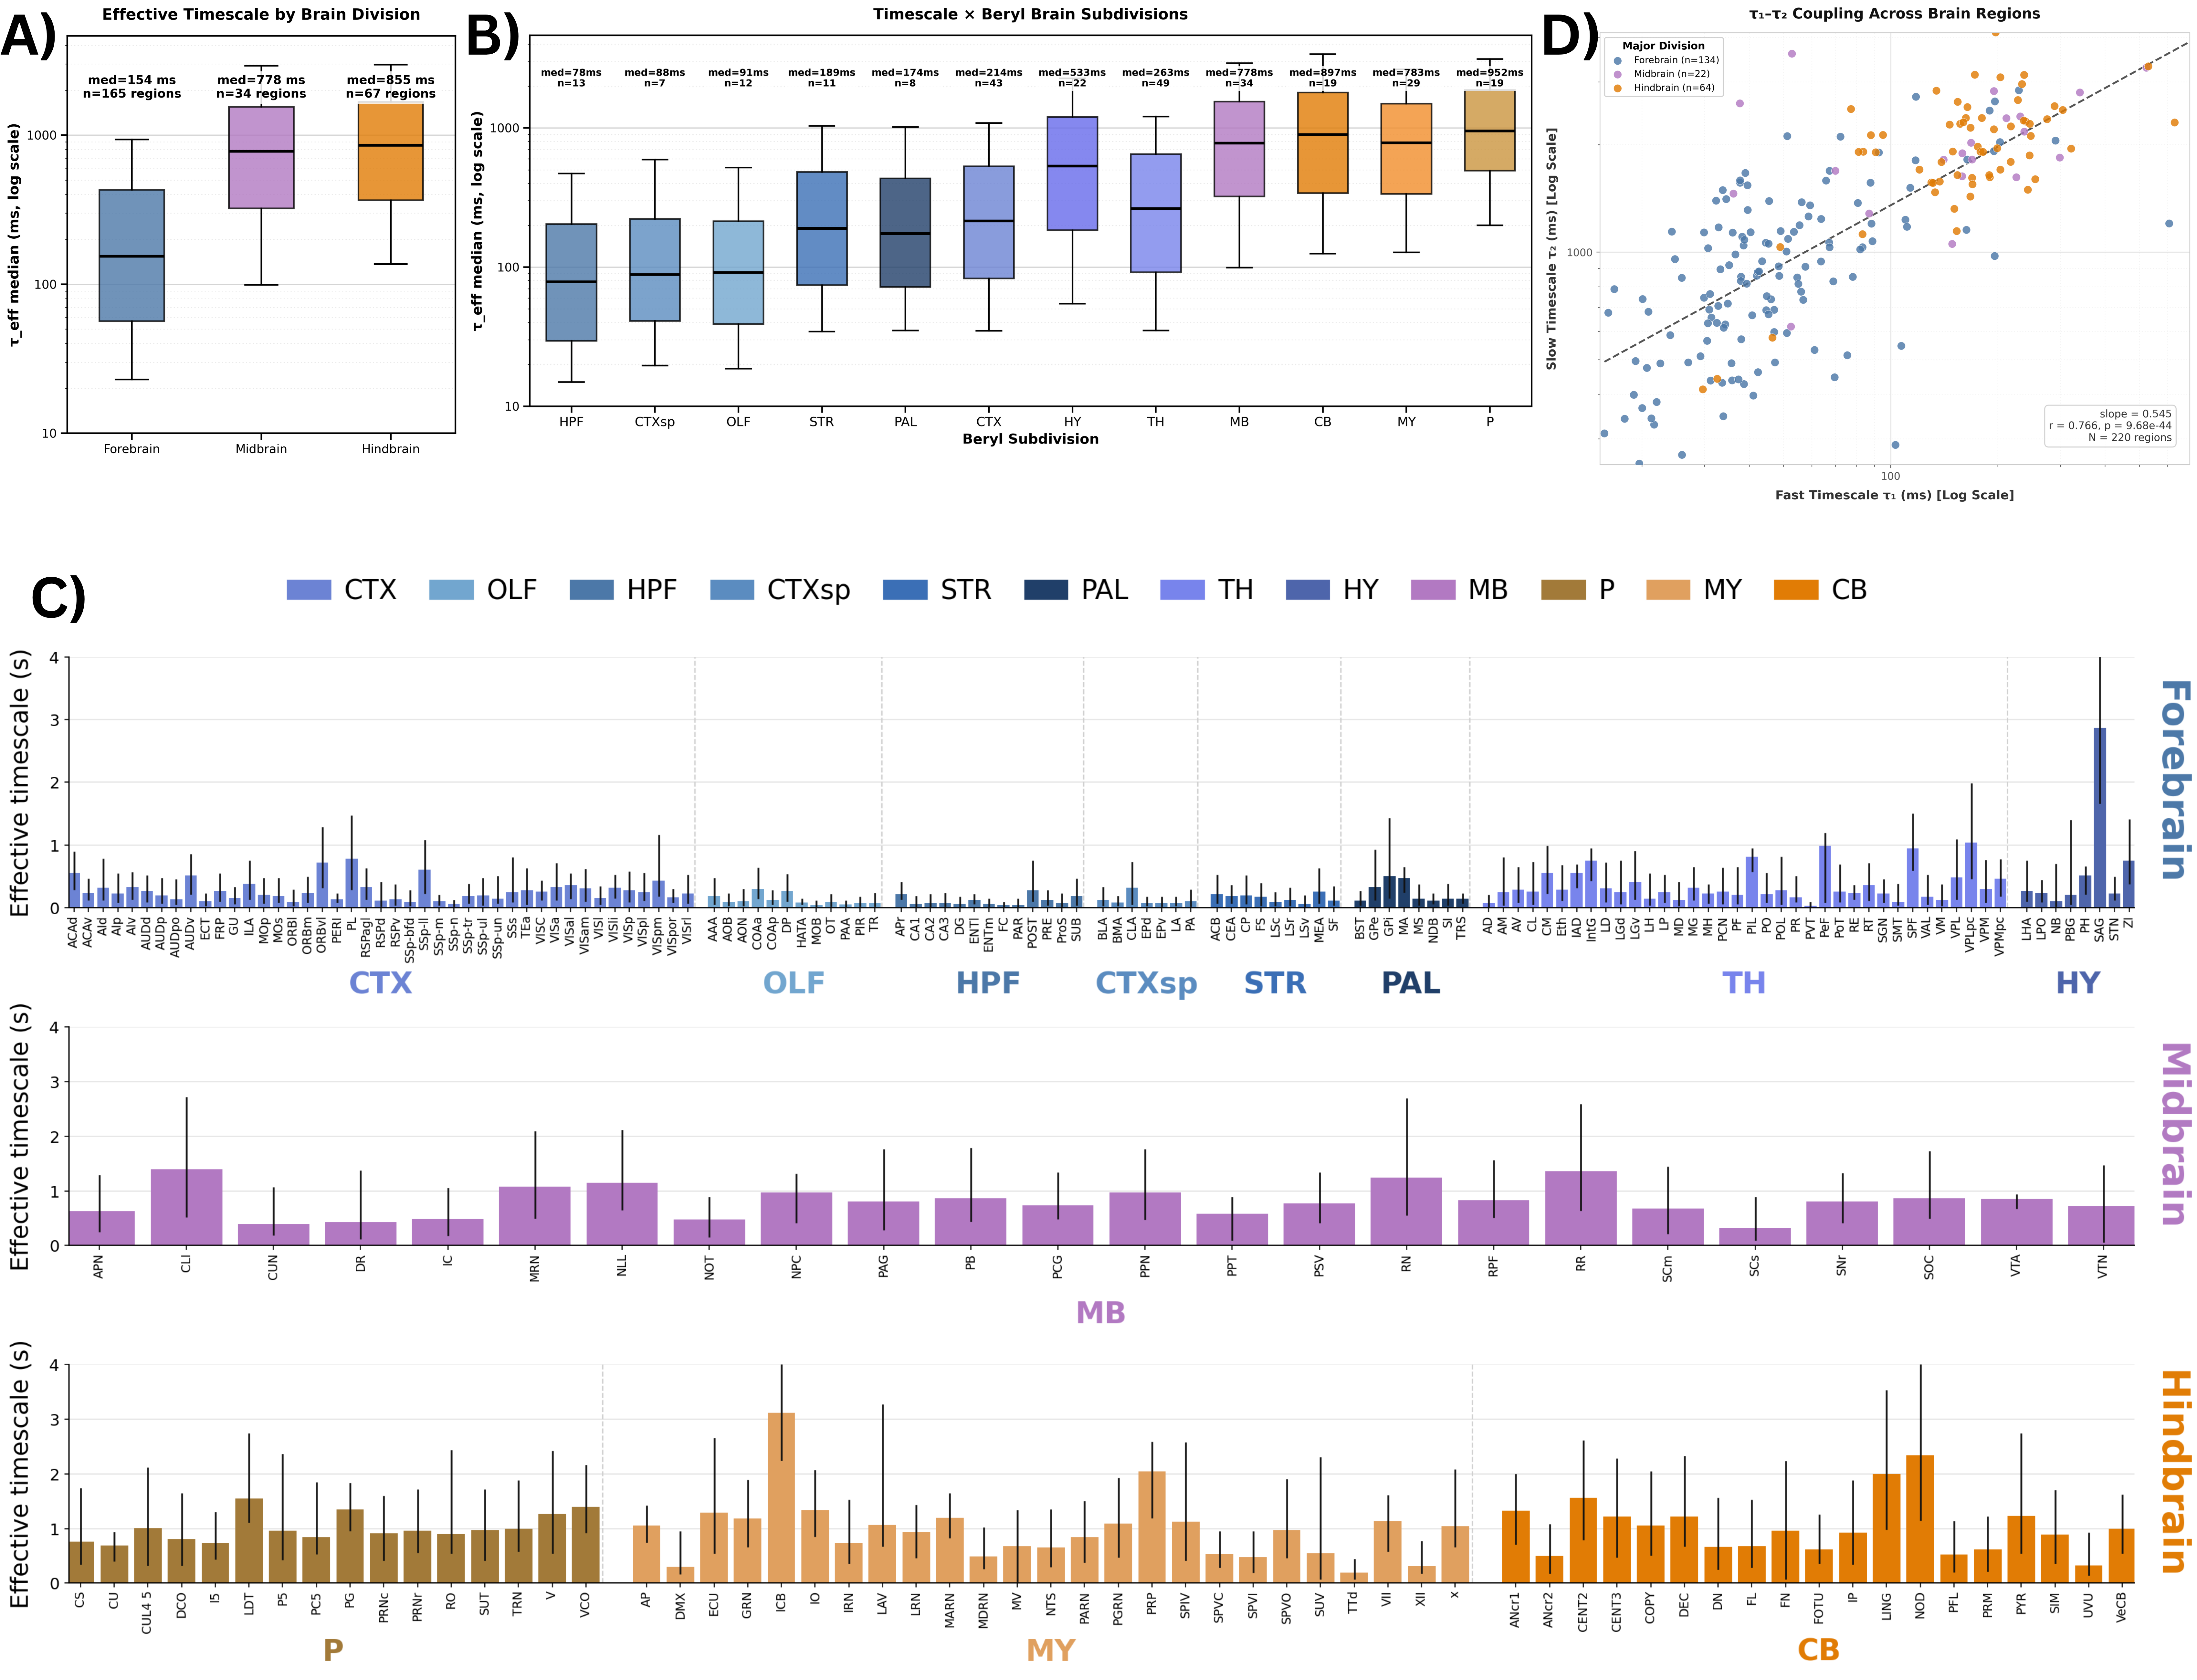 Brain-wide map of intrinsic neural timescales. (A) τ_eff by major brain division. (B) τ_eff across 12 brain subdivisions. (C) Median τ_eff per region; error bars show 10th–90th percentiles. Regions grouped by division, ordered alphabetically; colors denote subdivision. (D) Fast (τ₁) vs slow (τ₂) timescales across regions.References
1. Murray, J. D., et al. (2014). A hierarchy of intrinsic timescales across the primate cortex. Nat Neurosci, 17(12), 1661-1663. https://doi.org/10.1038/nn.3862
2. Pochinok, I., Hanganu-Opatz, I. L., & Chini, M. (2026). iSTTC: A robust method for accurate estimation of intrinsic neural timescales from single-unit recordings. PLOS Comput Biol, 22, e1013385. https://doi.org/10.1371/journal.pcbi.1013385
3. Shi, Y. L., et al. (2025). Brain-wide organization of intrinsic timescales at single-neuron resolution. bioRxiv. https://doi.org/10.1101/2025.08.30.673281
4. Beiran, M., & Ostojic, S. (2019). Contrasting the effects of adaptation and synaptic filtering on the timescales of dynamics in recurrent networks. PLOS Comput Biol, 15(11), e1007462. https://doi.org/10.1371/journal.pcbi.1007462
AcknowledgementSupported by Neuromatch Impact Scholars Program. Data from International Brain Laboratory 2025 Brainwide Map Release. We thank the IBL consortium for open data access and Jason Manley for supervision. Analysis builds on iSTTC methodology (Pochinok et al. 2026) and multi-exponential fitting framework (Shi et al. 2025).