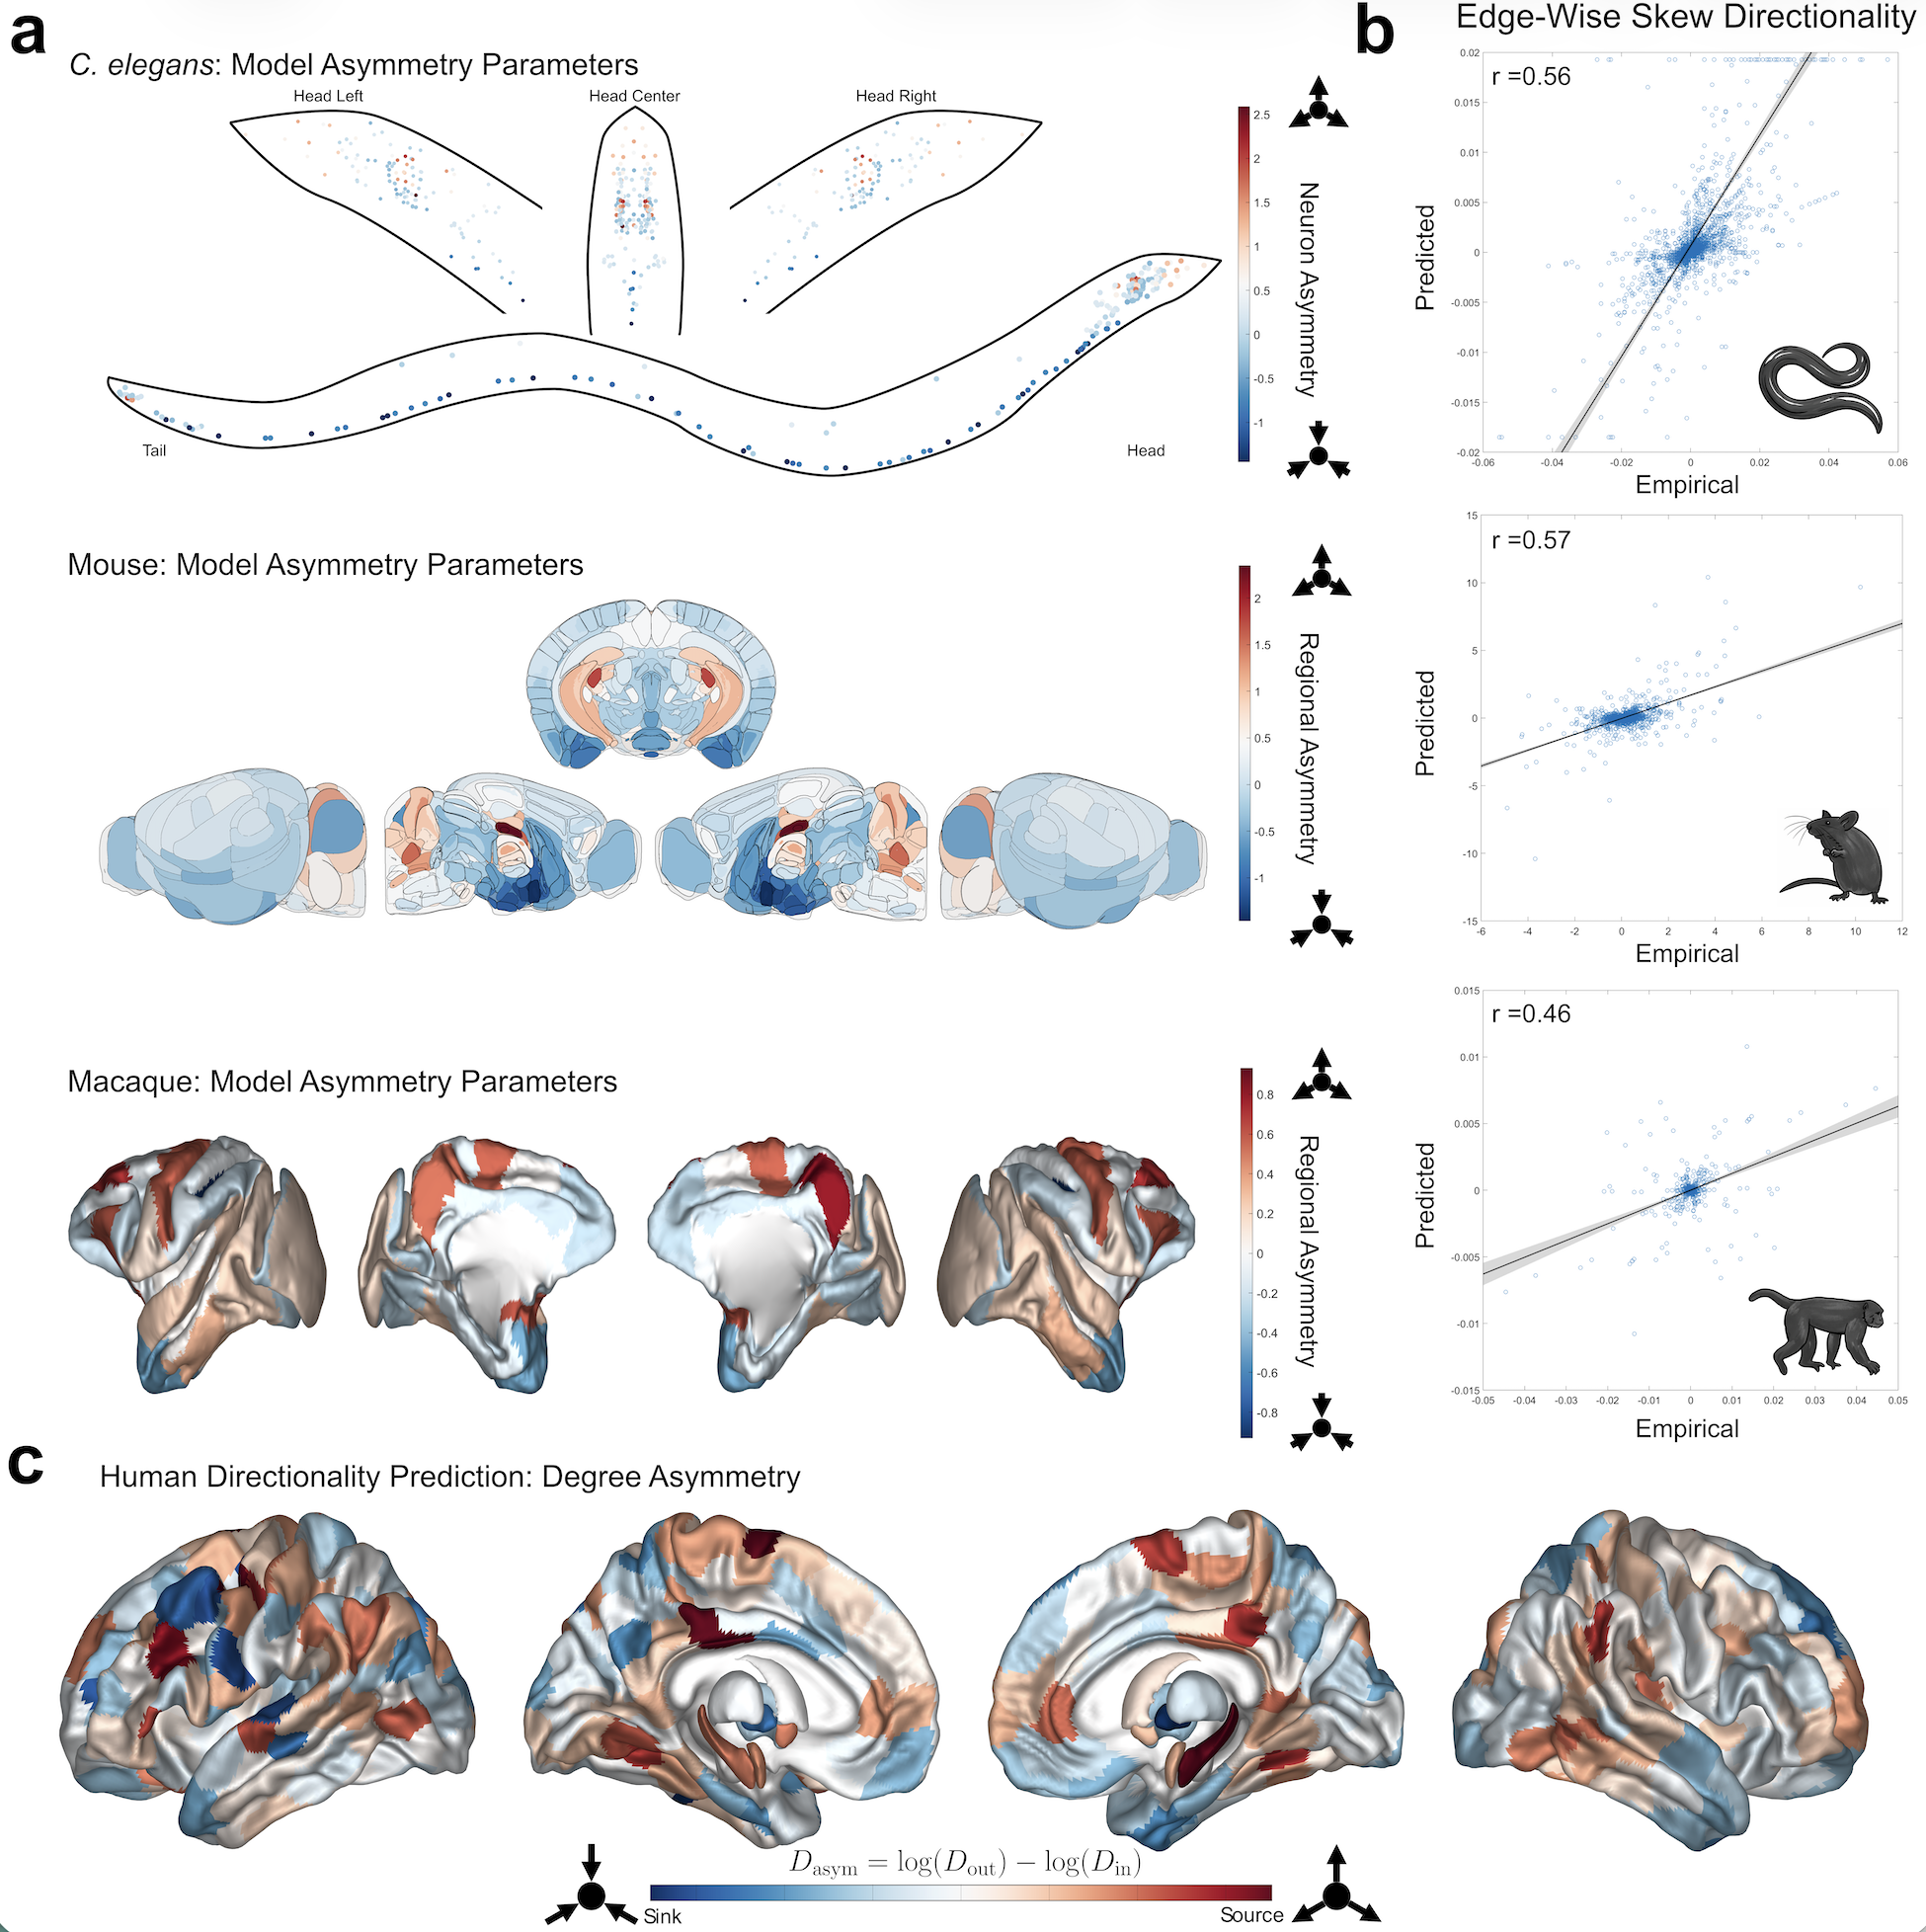
 Figure 1. (a) Model-estimated directionality parameters (e^{Ga}) for the three non-human species: C. elegans (top), Mouse (middle), Macaque (bottom). In the C. elegans plot, each dot represents a single neuron. (b) Scatter plots comparing empirical to predicted skew edges with Pearson correlations listed at the top left (all p<10^{-37}). (c) Predicted human overall degree asymmetry for 414 brain regions.